

Two families of wearable metrics drawn from the same week of tracker data sorted 984 adults in Singapore into activity groups that agreed less than half the time. Only the volume-based wearable metrics lined up consistently with blood, body-composition and heart measures.
Wearable Metrics built from raw movement counts and wearable metrics built from a device’s own intensity estimates placed the same people in different activity categories, according to a cross-sectional analysis published October 26, 2026 in Frontiers in Digital Health.
The analysis drew on SingHEART, a population-based cohort assembled by the National Heart Centre Singapore to study cardiovascular health in a healthy Asian population. Volunteers aged 21 to 69 were recruited through print advertising. People with known coronary artery disease, peripheral arterial disease, prior myocardial infarction, prior stroke or diabetes were excluded, and a history of hypertension was allowed only if the participant took no more than one blood-pressure medication.
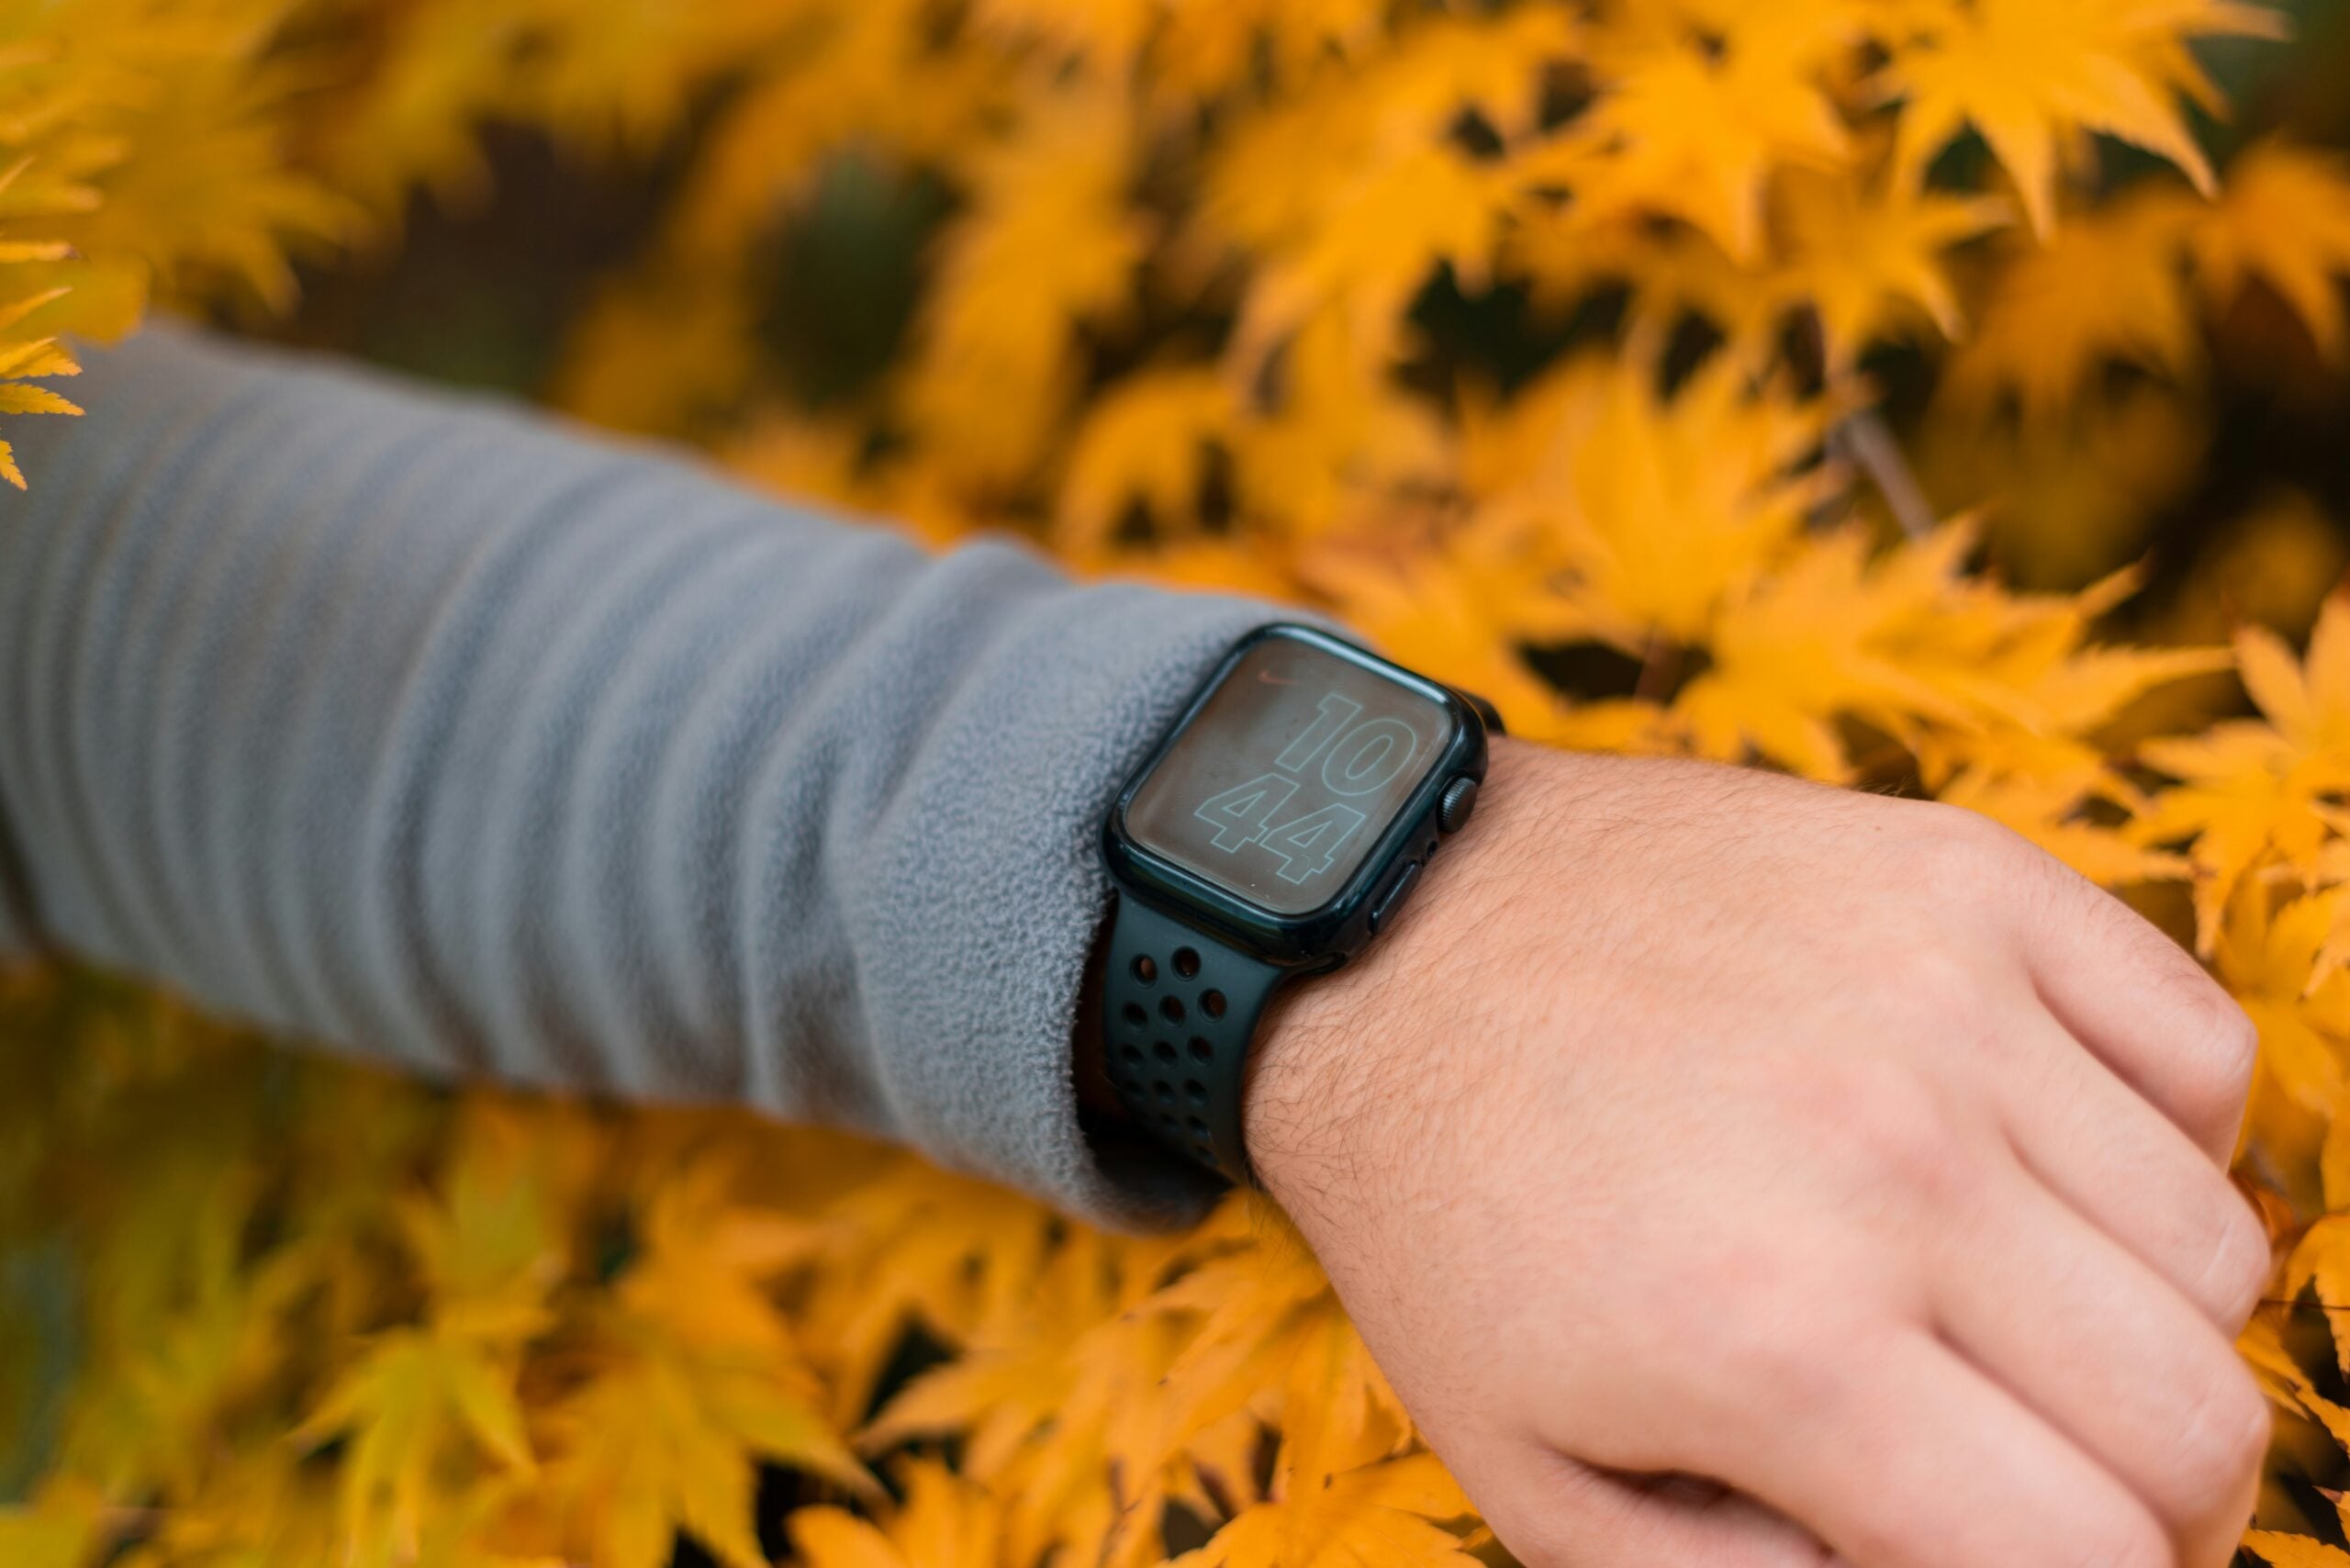
Participants wore a Fitbit Charge HR on the wrist for up to eight consecutive days, removing it only to charge. A day counted as valid if step data were present, anyone with fewer than three valid days was dropped, and the 984 adults left in the analysis averaged 7.1 valid days each. Their mean age was 45.6 years and 48.3 percent were male.
The team then ran two separate hierarchical cluster analyses using Ward linkage. One used volume-based wearable metrics such as steps, distance and floors climbed. The other used the device’s own intensity-based outputs, including active minutes and energy expenditure. Each produced five clusters, which were consolidated into four groups. The two sets of wearable metrics placed only 46.2 percent of participants, 454 of 983, into the same group.
At a Glance
- Published October 26, 2026 in Frontiers in Digital Health, in the journal’s Health Informatics section.
- Cross-sectional analysis of 984 adults in the SingHEART cohort in Singapore, mean age 45.6 years, 48.3 percent male.
- Activity was recorded with a wrist-worn Fitbit Charge HR over up to eight days, averaging 7.1 valid days per person.
- The volume-based groups were Sedentary (430), Average Movers (222), Regular Exercisers (219) and High-Variability Movers (113).
- The two sets of wearable metrics agreed on 46.2 percent of participants, an adjusted Rand index of 0.18.
- Volume-based active and sedentary groups differed on 106 of 250 blood biomarkers; the intensity-based comparison found none.
- The design was cross-sectional, so none of these associations can establish cause.
Why Two Sets of Wearable Metrics Split One Week Differently
Volume-based wearable metrics count what the wrist actually did: steps taken, distance covered, floors climbed. Intensity-based wearable metrics are inferences, produced when the device judges how hard a movement was and converts that judgement into active minutes or calories. Both arrive in the same app on the same evening, which makes them look like two views of one measurement rather than two different measurements.
The agreement statistic the authors reported, an adjusted Rand index of 0.18, sits far closer to the bottom of the scale than to the 1.0 that would mean identical grouping. Put plainly, knowing which volume-based category a participant fell into told you little about which intensity-based category they would fall into.
Where the Blood Biomarkers Diverged
The study tested 250 blood biomarkers against both classifications. Comparing the most active volume-based group with the sedentary group turned up differences in 106 of those biomarkers at a false discovery rate below 0.05. The same comparison built on the intensity-based groups produced no significant separation at all: a PERMANOVA p-value of 0.29, and zero individual biomarkers.
That is a sharp contrast rather than a marginal one. One set of wearable metrics tracked a broad metabolic signature. The other, derived from identical sensor data collected on the same wrists in the same week, did not.
Share of the 984 adults whom both sets of wearable metrics placed in the same activity group.
Body Composition and Cardiac Imaging Pointed the Same Way
Across 16 body-composition and cardiac magnetic resonance outcomes, the volume-based phenotypes were associated with 11 and the intensity-based phenotypes with 6. The directions of those associations also differed in ways that matter for interpretation.
Volume-based High-Variability Movers carried lower body fat, a beta of minus 0.38 standard deviations, and higher skeletal muscle, plus 0.33 standard deviations. The intensity-based High-Variability Movers ran the other way: higher BMI at plus 0.54 standard deviations and higher waist circumference at plus 0.45. Two groups wearing the same label described close to opposite bodies.
What the Group Sizes Say About Wearable Metrics
The volume-based solution put 430 of the 984 adults in the Sedentary group, 222 in Average Movers, 219 in Regular Exercisers and 113 in High-Variability Movers. Because the clustering is relative, those labels describe positions inside this particular cohort rather than fixed thresholds. Wearable metrics gathered from a different population would redraw the boundaries.
This is familiar ground for measurement research. Fitness Living Magazine has reported that smartwatch calorie burn estimates ran 15 percent to 25 percent off laboratory values, and that body fat prediction formulas showed large errors across a global validation. The new analysis moves that problem up a level, from a single wrong number to the category a person is sorted into.
Why the Device Algorithms Are Hard to Audit
The authors could not inspect the proprietary algorithms behind the intensity-based outputs, so they could not identify where the misclassification originated. They argue that step-based wearable metrics are more likely to be comparable across brands, because a step is defined by the movement itself rather than by one vendor’s model of effort.
The same auditability problem recurs across exercise testing. When this magazine covered automated ventilatory threshold detection coming within 29 mL/min of expert readers, the point was that an algorithm can be checked against an accepted standard. Consumer intensity estimates have no comparable public reference, which is why disagreement between two sets of wearable metrics is difficult to resolve from the outside.
What This Means for Reading Your Weekly Summary
None of this makes wearable metrics useless. It suggests that the figure worth leaning on is the one closest to the raw movement, and that the tidy category at the top of the weekly summary deserves less weight than the counts underneath it.
A few general points follow from the design. None of them is individualized advice, and anyone with a medical condition or a specific training question should raise it with a clinician or a qualified coach.
- Steps and distance are counted; active minutes and calorie figures are estimated. Treat the counted wearable metrics as the firmer number.
- Compare yourself with your own earlier weeks rather than with a category label, which shifts with whichever population the grouping was built on.
- Wrist sensors undercount cycling, swimming and resistance training, so keep a separate note of those sessions if they make up much of your week.
- A cross-sectional study cannot show that moving more caused any of the differences measured here.
Population guidance still rests on evidence gathered with research-grade devices rather than consumer wearable metrics. Our earlier report that 12 minutes of vigorous activity a week matched 150 moderate minutes for lower mortality came from that research literature, and the distinction matters when a wrist device and a study appear to say different things about the same week of movement.
The Fitness Living Takeaway
Two sets of wearable metrics taken from one week of the same wrist sensor agreed on only 46.2 percent of 984 adults, and only the volume-based set tracked blood, body-composition and heart measures consistently.
The result is about measurement rather than about exercise: it indicates that the activity label a tracker assigns depends on which processing pipeline produced it. The study was cross-sectional, drew on a predominantly Chinese and relatively healthy Singapore cohort, and used a single device brand, so the size of the gap could differ elsewhere. The usable conclusion is narrower and sturdier than the headline figure: steps are measured, intensity is inferred.
Research & Sources
- Frontiers in Digital Health: Physical activity phenotypes from volume-based versus intensity-based wearable metrics
- Study DOI
- Images: Reyhan Aviseno / Unsplash; Harry Shelton / Unsplash
This article summarizes peer-reviewed research for general information and is not individualized medical or exercise advice.