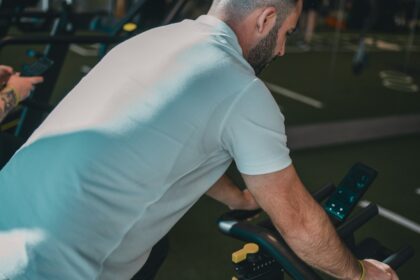

A 12-year review of United States emergency department records estimates that exercise-related injuries were the largest single category among five common sports and recreation activities. Cycling produced slightly fewer visits but by far the highest share of hospital admissions.
Exercise-Related Injuries accounted for an estimated 5.49 million emergency department visits in the United States between 2013 and 2024, according to a national epidemiological analysis published on September 26, 2026 in BMC Sports Science, Medicine and Rehabilitation.
The work came from orthopaedics and traumatology researchers in Türkiye, with authors at Yalova Training and Research Hospital, the School of Medicine at Gaziantep University, and Acibadem University in Istanbul. They drew on the National Electronic Injury Surveillance System, or NEISS, a programme run by the United States Consumer Product Safety Commission, and narrowed the sample to the five highest-volume sports and recreation categories: basketball, bicycle and accessories, exercise and exercise equipment, football, and playground equipment.
Weighted national estimates were generated using NEISS sampling weights. Across the five categories the authors estimated 21.8 million sports- and recreation-related injuries over the 12-year window. Exercise-related injuries led that count at an estimated 5.49 million, with cycling-related activities close behind at an estimated 5.31 million.
The ordering reversed when the team switched from volume to severity. Cycling-related injuries showed the highest hospitalization proportion at 11.1 percent, while basketball showed the lowest at 1.6 percent. That is roughly a sevenfold spread between the two ends of the same five-activity list.
At a Glance
- Published September 26, 2026 in BMC Sports Science, Medicine and Rehabilitation.
- Retrospective epidemiological analysis of the National Electronic Injury Surveillance System covering 2013 through 2024, with weighted national estimates.
- An estimated 21.8 million sports- and recreation-related injuries across basketball, bicycle and accessories, exercise and exercise equipment, football and playground equipment.
- Exercise-related injuries were the largest category at an estimated 5.49 million; cycling-related activities followed at 5.31 million.
- Cycling carried the highest hospitalization proportion at 11.1 percent; basketball carried the lowest at 1.6 percent.
- Males accounted for 71.9 percent of injuries, and individuals aged 5 to 14 years were the most affected age group.
- Main caveat: hospitalization status was evaluated as an indirect proxy for injury severity rather than measured clinically.
Where Exercise-Related Injuries Sat in the National Count
The exercise and exercise equipment category is broad by design. In NEISS coding it spans treadmills, stationary cycles, weight machines, free weights and general conditioning gear, so exercise-related injuries in this dataset cover a wide range of gym and home-workout scenarios rather than one movement or one machine.
That breadth is part of why exercise-related injuries topped the volume table. It is also why the 5.49 million estimate is best read as a description of a large activity bucket, not as a verdict on any particular piece of equipment or style of training.
Why Cycling Looked More Severe Than Its Volume Suggested
Multivariable logistic regression confirmed that cycling-related injuries carried higher odds of hospitalization than basketball, football and exercise-related injuries. Hospitalization odds for cycling were comparable to playground-related injuries, the other category in the analysis with a high fracture and head injury share.
The injury mix helps explain the gap. Head and neck injuries were most frequent in cycling-related cases at 30.1 percent and playground-related cases at 34.3 percent. Fractures were more common in playground-related injuries at 34.4 percent and cycling-related injuries at 23.6 percent.
Volume alone would put exercise-related injuries at the front of any prevention conversation. Weighting by admission changes that. At 11.1 percent against 1.6 percent for basketball, cycling moved proportionally far more patients from the emergency department to an inpatient bed, and the regression held that difference after adjustment for age, sex and injured body region.
Share of cycling-related emergency department cases that ended in hospitalization, against 1.6 percent for basketball, the lowest of the five activity categories.
What Kind of Injuries Each Activity Produced
Strain and sprain injuries predominated across the dataset as a whole. They made up 37.1 percent of basketball cases and 27.8 percent of exercise-related injuries, the two categories where soft tissue overload rather than impact drove most of the visits.
Read together, the profiles describe different kinds of risk rather than different amounts of it. Exercise-related injuries clustered in soft tissue. Cycling and playground cases clustered in bone and in head and neck trauma. A single ranking of totals hides that distinction entirely.
Who Was Getting Hurt, and at What Age
Males accounted for 71.9 percent of all injuries in the dataset. Individuals aged 5 to 14 years represented the most affected age group by volume, which is consistent with a sample that includes both playground equipment and youth team sport. FLM has previously covered a review of supervised resistance training in young people, which pooled 23 studies in 1,443 participants.
Severity ran in the opposite direction. Advancing age, particularly age 65 years and older, was associated with greater odds of hospitalization among emergency-department-treated cases. Younger people supplied most of the visits; older people were likelier to be admitted once they arrived. That split matters for how a household reads the numbers.

What a Five-Category Snapshot Can and Cannot Settle
The analysis was built to compare high-volume activities across all age groups, a gap the authors describe as persisting despite the size of the sports and recreation injury burden. Its strength is scale: 12 years of records and a sampling design intended to support national estimates. Its limit is that the categories are administrative rather than physiological.
Exercise-related injuries, in that sense, is a surveillance label and not a clinical one. Two patients coded into the same bucket may have arrived after a missed barbell lift and after a stumble on a treadmill, events with little in common beyond the equipment involved. Comparisons across such buckets carry real information, but coarser information than a trial would produce.
The 2020 Drop and the Rebound That Followed
Injury volumes declined sharply in 2020 and then rebounded to levels exceeding those recorded before the pandemic. The authors report the shape of that curve without assigning it to a single cause.
The practical reading is that these totals track participation and access as closely as they track hazard. A year with fewer open gyms and fewer organised games produces fewer exercise-related injuries without anything about the underlying activities having changed. The rebound above pre-pandemic levels suggests the reverse also holds.
How Exercise-Related Injuries Fit Into a Weekly Training Plan
A ranking of emergency department volume is not a ranking of how hazardous an activity is per hour. Without an exposure denominator, a category used by tens of millions of people can top the table while carrying low risk in any individual session. The finding that exercise-related injuries were the most numerous is, first of all, a statement about how many people exercise.
The severity signal is the more actionable half of the paper. Head and neck injuries concentrated in cycling, and fractures concentrated in cycling and playground cases, both of which point toward impact protection rather than toward conditioning. It is a different lever from the one that accelerometer research on vigorous activity and mortality addresses.
It is also worth separating what these numbers say about a population from what they say about a training week. Somebody choosing between a spin class and a barbell session cannot read a personal risk ratio out of the totals, because exercise-related injuries and cycling-related injuries here describe national emergency traffic rather than matched groups doing matched amounts of work.
General, non-individualised points that follow from the injury mix:
- Helmet use on a bicycle is the single most obvious safeguard, given the 30.1 percent head and neck share in cycling-related cases.
- Expect the gym profile to be soft tissue: the 27.8 percent strain and sprain share in exercise-related injuries argues for gradual load progression and an unhurried warm-up.
- Supervise children on playground equipment, where fractures reached 34.4 percent of cases.
- After 65, treat any fall or collision as worth a clinical look, because admission odds rose with age in this dataset.
None of that substitutes for individual advice from a clinician or coach. Readers working on fall risk may find the reactive balance training trial in older adults useful context, since it improved stepping responses without lowering fall rates. Those tracking in-session problems rather than emergencies can compare the risk-factor review on exercise-associated muscle cramps.
The Fitness Living Takeaway
Across 12 years of United States emergency department data, exercise-related injuries were the most numerous of five common activity categories at an estimated 5.49 million, while cycling-related injuries were the likeliest to end in hospitalization at 11.1 percent.
Volume follows participation, so exercise-related injuries topping that list mostly reflects how many people use gyms and exercise equipment. Severity followed impact instead, concentrating in cycling and playground cases. Because hospitalization served as an indirect proxy for severity and the analysis carries no measure of exposure time, the study describes where injuries show up rather than how risky any single session is.
Research & Sources
- BMC Sports Science, Medicine and Rehabilitation: Cycling-related injuries demonstrate the highest hospitalization proportion, whereas exercise-related activities account for the largest injury burden
- Study DOI
- US Consumer Product Safety Commission: NEISS injury data
- Images: Nate Johnston / Unsplash; Angel Santos / Unsplash
This article summarizes peer-reviewed research for general information and is not individualized medical or exercise advice.