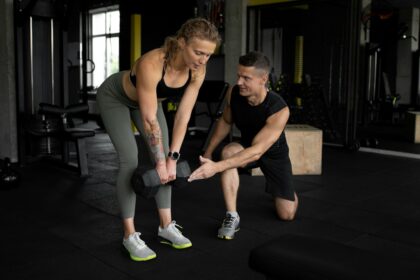

A new CDC surveillance report scored cardiovascular health in a nationally representative sample of US high school students and placed only one in five in the top band. Physical activity ranked among the three weakest of the five metrics the analysis measured.
Cardiovascular health among American teenagers clusters in the middle of the scale rather than at the top, according to a surveillance report carried in the October 15, 2026 issue of MMWR Supplements. Drawing on the 2025 Youth Risk Behavior Survey, CDC researchers scored five cardiovascular health metrics for every student with complete data and found that 20.7% landed in the high band.
The analysis was led by Izraelle I. McKinnon and colleagues at the CDC Division of Adolescent and School Health in Atlanta, Georgia, with co-authors from the US Public Health Service and the agency Division for Heart Disease and Stroke Prevention. The 2025 Youth Risk Behavior Survey collected responses from 10,710 high school students across the country.
Of those, 5,192 students, about 48% of the total, had usable answers for all five metrics and formed the analytic sample. The team adapted the American Heart Association Life’s Essential 8 framework, scoring diet, physical activity, sleep health, body mass index and nicotine exposure on a 0 to 100 scale and averaging them.
The mean overall cardiovascular health score was 65.3, which the report classes as moderate. Diet scored lowest at 39.3, followed by sleep health at 59.1 and physical activity at 62.0. Body mass index, at 85.4, and nicotine exposure, at 80.5, were the two strongest metrics in the set.
At a Glance
- Published in the October 15, 2026 issue of MMWR Supplements, volume 75, supplement 1, pages 25 to 34.
- Cross-sectional analysis of the 2025 Youth Risk Behavior Survey, a nationally representative survey of 10,710 US high school students.
- 5,192 students, roughly 48% of respondents, had complete data on all five cardiovascular health metrics and were analyzed.
- Overall, 20.7% of students had high cardiovascular health scores, 61.3% had moderate scores and 18.0% had low scores.
- Mean overall score was 65.3 out of 100; physical activity averaged 62.0 and diet averaged 39.3.
- Female students scored lower than male students on physical activity and on overall cardiovascular health.
- Main caveat: every measure was self-reported, and about 52% of respondents were excluded for incomplete data.
How the Five Cardiovascular Health Metrics Were Scored
The CDC team did not measure cardiovascular health in a clinic. It built an index from survey answers, mapping each response to a points value and then averaging the five metric scores into one composite figure for each student.
Scores of 80 or above counted as high, 50 to 79 as moderate and below 50 as low. That structure matters for reading the result: a single weak metric can pull an otherwise strong cardiovascular health profile down into the moderate band, and a single strong metric can lift a weak one up.
Diet drew on reported fruit, vegetable and sugary drink intake. Nicotine exposure covered the student own use rather than smoke from other people. Body mass index came from self-reported height and weight, which the authors flag as a likely source of underestimation.
Physical Activity Sat in the Middle of the Range
The physical activity metric averaged 62.0 points. In the report wording, scores were moderate for physical activity at 62.0 and sleep health at 59.1, leaving those two alongside diet as the three components holding the composite down.
That ordering is the practical headline for anyone working on cardiovascular health with teenagers. The metrics that depend on daily behavior, rather than on a number like body mass index, are the ones where the sample lost the most ground.
Female students recorded lower physical activity scores than male students. The report does not break the activity metric down further, so the gap cannot be traced to a particular sport, school setting or time of day from this analysis alone.
The mean physical activity score out of 100 across 5,192 US high school students, one of the three weakest of the five metrics measured.
Scores Slipped Through the Later High School Grades
Overall cardiovascular health scores were lower in grades 10 through 12 than in grade 9, and lower in grade 12 than in grade 10. The pattern runs in one direction across the four years covered by the survey.
It is tempting to read that as decline, but the design does not allow it. The survey captures different students at each grade level on a single occasion, so it cannot show an individual teenager losing cardiovascular health as school progresses.
Comparable age patterns appear elsewhere in the literature. Work on physical fitness and arithmetic fluency in adolescents and on body fat and motor fitness in children has tracked similar divergence between younger and older school cohorts.
Differences by Sex and Race Were Wide
Female students had lower overall cardiovascular health scores than male students, a gap that showed up in the physical activity metric as well as the composite. The report presents these as descriptive differences rather than explained ones.
By race and ethnicity, Asian students recorded the highest mean overall score and Black students the lowest. The analysis does not attempt to separate the contribution of neighborhood, school resources, household circumstances or access to facilities.
That gap in explanation is where surveillance work usually hands off to study designs that can follow people over time, as larger cohort research on estimated cardiorespiratory fitness across three large cohorts has done for adults.

What the Report Does Not Measure
Three of the eight components in the Life’s Essential 8 framework were unavailable in the survey: blood pressure, blood lipids and blood glucose. All three normally require an exam or a blood draw, and none could be approximated from a classroom questionnaire.
Sleep over 10 hours and exposure to other people smoke were also outside the available data. The authors are direct about the consequence, writing that the five-metric scores should not be interpreted as a full clinical assessment of cardiovascular health.
About 52% of respondents were dropped for incomplete data, through nonresponse, invalid answers and differences in how the questionnaire was administered. The analytic sample included a greater share of White students, 52.5%, than the excluded group, 41.8%.
How This Fits With Other Cardiovascular Health Research
Surveillance reports like this one answer a different question from trials. They describe where a population currently sits, which is why the numbers are useful for schools and health departments setting cardiovascular health priorities rather than for individual advice.
Trials and large cohorts handle the dose question instead. Earlier coverage of how much exercise heart health really requires looked at what weekly volumes were associated with lower risk in adults, a separate line of evidence from this snapshot of teenagers.
Read together, the two kinds of study point the same way. The behaviors that moved adult risk in cohort work are the same ones scoring weakest in this adolescent sample, which is the argument for acting before adulthood rather than after.
What Families and Coaches Can Reasonably Take From It
This is a population estimate, not a screening tool. A teenager cannot be scored from the report, and nothing in it tells a parent whether a particular child needs attention. That is a question for a clinician with access to measurements the survey never collected.
What the numbers do support is a sense of where the slack is. Across this sample, the components that lagged were the daily ones, which is the least surprising and most actionable part of the finding.
- Movement, sleep and diet carried the lowest scores, so they are the reasonable first places to look at a school or household level.
- Any individual concern about cardiovascular health belongs with a clinician, who can measure blood pressure and lipids that this analysis could not.
For young athletes already training, the relevant point is coverage rather than intensity. A student can sit in a moderate band on this index while playing a competitive sport, because the composite also counts sleep, diet and body mass index.
The Fitness Living Takeaway
About four in five US high school students scored low or moderate on a five-metric cardiovascular health index built from the 2025 Youth Risk Behavior Survey, with physical activity averaging 62.0 out of 100.
The strength of the report is its scale and its national sampling frame; the limit is that every input was self-reported and three clinical components of the underlying framework were missing. It describes a population at one moment and cannot say whether any individual student is at risk, or whether these scores are improving or worsening over time.
Research & Sources
- MMWR Supplements: Cardiovascular Health Among High School Students, Youth Risk Behavior Survey, United States, 2025
- Study DOI
- News-Medical: coverage of the CDC adolescent heart health findings
- Images: Gurdaas Malik / Unsplash; Eugene Chystiakov / Unsplash
This article summarizes peer-reviewed research for general information and is not individualized medical or exercise advice.