A Belgian validation study reports that an automated algorithm placed the first ventilatory threshold within 29 mL/min of two expert readers across 262 healthy adults. At the level of the individual test, however, the ventilatory threshold estimate could land as much as 199 mL/min away.
Ventilatory threshold detection, the step that sets the boundary between easy and moderately hard aerobic work, matched expert visual assessment closely at group level in a validation study published on 11 October 2026 in Sports Medicine – Open. Individual agreement was looser, and the authors say automated values still need an expert eye before they shape an individual training plan.
The work was led by Margot Vermeiren of the KU Leuven Department of Cardiovascular Sciences, with colleagues from University Hospitals Leuven, the KU Leuven Department of Rehabilitation Sciences and the Interuniversity Centre for Biostatistics and Statistical Bioinformatics. The paper was received on 18 May 2026 and accepted on 28 September 2026.
It is a retrospective study. The team drew on cardiopulmonary exercise test records from 271 healthy adults collected at University Hospitals Leuven between 2010 and 2020. Mean age was 46 years with a standard deviation of 13, and 61% of participants were female.
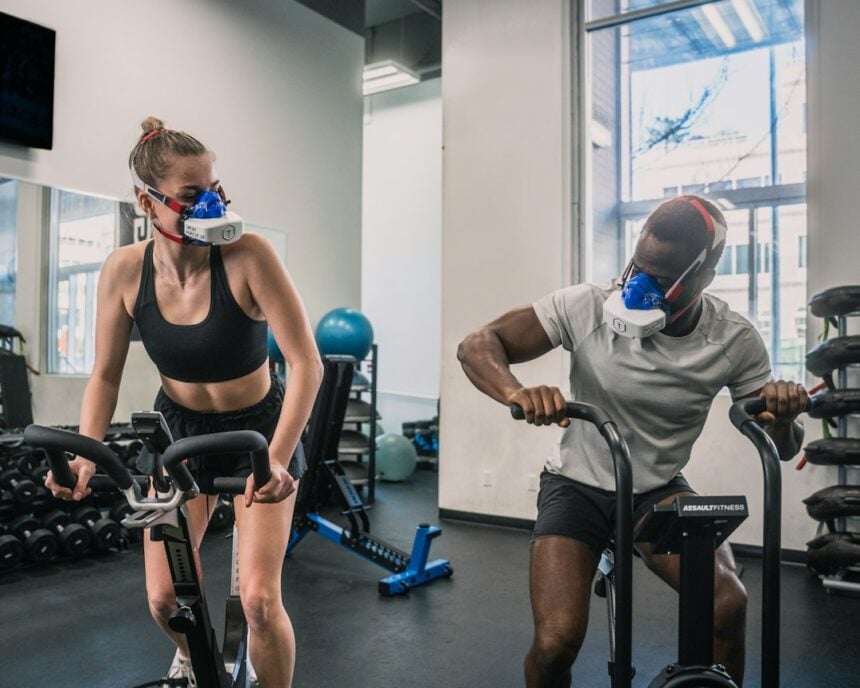
A ventilatory threshold could be determined in 262 of those tests, and that subset formed the comparison sample. The standard cycle protocol began at 20 Watts with increments of 20 W per minute, a ramp familiar to anyone who has sat through a laboratory fitness assessment.
At a Glance
- Published 11 October 2026 in Sports Medicine – Open, volume 12, article 153.
- Retrospective analysis of cardiopulmonary exercise tests from 271 healthy adults gathered between 2010 and 2020.
- Mean age 46 years, standard deviation 13 years, and 61% female; a ventilatory threshold was identifiable in 262 tests.
- Median oxygen uptake at the threshold was 1151 mL/min by algorithm against 1122 mL/min by eye, p < 0.001.
- Mean difference 29 mL/min (95% CI 19 to 40); relative bias 2.2% with a standard deviation of 7.1%.
- Agreement was strong overall, with an intraclass correlation of 0.97 (95% CI 0.96 to 0.98) and a Deming slope of 0.95.
- Individual limits of agreement spanned minus 140 to plus 199 mL/min, beyond the 100 mL/min boundary the team had set in advance.
Why the First Ventilatory Threshold Is Hard to Pin Down
During a graded exercise test, carbon dioxide output begins to climb faster than oxygen uptake at a certain workload. The point where that relationship bends is the first ventilatory threshold, and it marks the upper edge of genuinely comfortable aerobic effort.
Traditionally the bend is found by eye. Two trained readers inspect the plot of carbon dioxide output against oxygen uptake, known as the V-slope, and mark the breakpoint. The method works, but it is slow, it requires expertise, and different readers can place the ventilatory threshold in slightly different places.
That variability is the practical problem the Leuven group set out to address. If an algorithm can place the first ventilatory threshold reliably, large research datasets become far easier to process and clinical testing becomes less dependent on who happens to be reading the chart.
What the Leuven Team Compared
The reference standard was human. The threshold was identified for all tests by two experienced observers through direct visual inspection of the breakpoint, and the revised V-slope algorithm was then run against those readings.
Four statistical approaches were used rather than one. Bland-Altman analysis described the spread of disagreement, intraclass correlation coefficients described reliability, Deming regression tested for proportional error, and equivalence testing asked whether the ventilatory threshold values fell inside a pre-specified margin of 100 mL/min.
Setting that margin in advance matters. It converts a vague question about whether two methods are close enough into a testable one, and it means the study can report a clear failure as well as a clear success.
Where Algorithm and Observers Agreed
At group level the agreement was close. Median oxygen uptake at the ventilatory threshold was 1151 mL/min by algorithm and 1122 mL/min by visual assessment, a statistically significant difference at p < 0.001 but a small one in absolute terms.
The mean difference was 29 mL/min, with a 95% confidence interval from 19 to 40 mL/min. Expressed proportionally, the relative mean bias was 2.2% with a standard deviation of 7.1%, and the relative limits of agreement ran from minus 11.7% to plus 16.0%.
Reliability statistics were strong. The intraclass correlation coefficient reached 0.97 with a 95% confidence interval of 0.96 to 0.98, and Deming regression produced a slope of 0.95 (95% CI 0.92 to 0.99), close enough to one to argue against meaningful proportional bias across the measurement range.
The average gap between the automated ventilatory threshold estimate and the value two experienced readers marked by eye.
Where the Agreement Broke Down
The individual picture was less tidy. Absolute 95% limits of agreement ran from minus 140 to plus 199 mL/min, which the authors note exceeds the pre-specified boundary of 100 mL/min. For a single person taking a single test, that is a wide window.
Equivalence testing within plus or minus 100 mL/min was nonetheless significant, which looks contradictory until the two questions are separated. Equivalence testing asks about the average. Limits of agreement ask how far any one result might sit from the reading a human would give.
That distinction drives the conclusion. The authors support research use of the algorithm in healthy adults while advising that automated ventilatory threshold values be reviewed by an expert before they are used to guide an individual exercise prescription.

Human Readers Did Not Agree Perfectly Either
One of the more useful numbers in the paper concerns the humans. Interobserver agreement between the two experienced readers produced a single-measure intraclass correlation of 0.93, with a 95% confidence interval of 0.90 to 0.95.
That is high, but it is lower than the 0.97 recorded between algorithm and consensus reading. The visual method, in other words, carries its own noise, and some of the disagreement attributed to automation is really disagreement about where a ventilatory threshold sits.
It reframes the comparison. The question is not whether an algorithm can be perfect, but whether it can be as consistent as a skilled reader while being very much faster, and on these data it comes close.
How This Fits Alongside Other Threshold Research
Threshold measurement has been a recurring theme in exercise science reporting. Fitness Living Magazine has covered work showing that the rate of lactate accumulation tracked threshold power in 182 cyclists and triathletes, and a separate effort to build a standardised VO2 max framework across five different exercise tests.
Both speak to the same underlying difficulty, which is that aerobic capacity has several defensible definitions and several defensible measurement routes. Earlier coverage of estimated cardiorespiratory fitness and disease risk across three large cohorts showed how much rides on getting those definitions right, and the same logic applies to the companion report that aerobic exercise improved endothelial function across 72 randomized trials.
What a Ventilatory Threshold Number Is Worth to a Training Plan
Many endurance plans are built around the boundary this study is measuring. The zone below the first ventilatory threshold is where long easy sessions belong, and the zone above it is where work starts to accumulate fatigue more quickly.
The caution from this paper is about precision rather than principle. If a single automated reading can sit up to 199 mL/min away from what an expert would mark, then treating one number as a fixed personal boundary is a stretch, especially when the test was not a maximal effort.
- A laboratory ventilatory threshold is a snapshot from one test on one day, not a permanent setting.
- Automated output is best read as a starting estimate that a qualified professional can sanity-check against how sessions actually feel.
- Nothing here changes general activity guidance, and none of it is a substitute for clinical advice where a heart or lung condition is involved.
The Fitness Living Takeaway
A revised V-slope algorithm placed the first ventilatory threshold an average of 29 mL/min from expert visual readings across 262 healthy adults, with an intraclass correlation of 0.97.
That is strong enough to speed up research on large exercise-testing datasets, where group averages are what matter. It is not strong enough to hand an individual a definitive training boundary, because limits of agreement stretched from minus 140 to plus 199 mL/min and the sample covered only relatively healthy adults. The authors recommend expert review before any automated ventilatory threshold value guides a personal prescription.
Research & Sources
- Sports Medicine – Open: Validation of a Revised V-Slope Algorithm for Automated First Ventilatory Threshold Detection in Healthy Adults
- Study DOI
- Images: VO2 Master / Unsplash; Josh Nuttall / Unsplash
This article summarizes peer-reviewed research for general information and is not individualized medical or exercise advice.