Neuromuscular fatigue did not scramble the rowing stroke so much as compress it, pulling head, shoulder and hand landmarks measurably lower. The joint angles that coaches usually watch were the part of the picture neuromuscular fatigue left least certain.
Neuromuscular fatigue lowered the posture of 19 elite fixed-seat rowers by up to 31 mm at the catch, according to a within-subject three-dimensional kinematic study published on October 5, 2026 in Frontiers in Sports and Active Living.
The work came from Alfonso Penichet-Tomas of the University of Alicante with Patxi León-Guereño and Arkaitz Castañeda-Babarro of the University of Deusto in Bilbao. All 19 rowers competed in the ACT, described in the paper as the highest division of Traditional fixed-seat rowing, and each had at least five years of competitive experience, with a range of 5 to 23 years.
The group averaged 29.4 years of age with a standard deviation of 7.0, stood 182.0 cm tall and weighed 78.2 kg. Two rowers did not complete the post-fatigue assessment and some reflective markers detached during the effort, so paired analyses included no more than 17 complete cases for any single variable.
Rowers were measured before and after an incremental test to voluntary exhaustion on a fixed-seat ergometer, a protocol that started at 150 W and rose 35 W every four minutes. Three-dimensional kinematics were captured with an STT Systems 3DMA setup, and comparisons used paired-samples t-tests with a Benjamini-Hochberg correction and Cohen d as the effect size.
At a Glance
- Published October 5, 2026 in Frontiers in Sports and Active Living, DOI 10.3389/fspor.2026.1950960.
- Within-subject pre-post design in 19 elite male Traditional rowers, with 17 or fewer complete cases per variable.
- At the catch, shoulder height fell from 914.3 mm to 882.9 mm, a drop of 31.4 mm, adjusted p = 0.002, d = -1.15.
- Head height at the catch fell 18.3 mm, adjusted p = 0.002, d = -1.19, and hand height fell 14.2 mm, adjusted p = 0.042.
- At the finish, head height fell 24.7 mm and hand height 26.6 mm, both adjusted p = 0.024.
- Vertical center of gravity dropped 11.5 mm at the catch and 13.7 mm at the finish, both adjusted p = 0.045, d = -0.64.
- Main caveat: joint-angle changes did not survive correction for multiple comparisons and are reported by the authors as exploratory.
Height, Not Angle, Was the Signal That Held
The distinction the paper draws is a careful one. Segment heights and center of gravity moved under neuromuscular fatigue in a way that survived statistical correction. Joint angulations moved too, but only as unadjusted trends, so the authors report them as exploratory rather than as findings.
That ordering is unusual in neuromuscular fatigue research, where angles are the familiar currency. Here the most robust evidence of neuromuscular fatigue was vertical: the whole upper body settled closer to the boat. Head, shoulder and hand landmarks at the catch all dropped together, and two of the three repeated the pattern at the finish.
How far shoulder height at the catch fell after the fatigue protocol, the largest single change that survived correction for multiple comparisons.
What the Neuromuscular Fatigue Protocol Actually Did
The test was demanding by any measure. Heart rate at exhaustion averaged 187.5 bpm with a standard deviation of 8.9, perceived exertion reached 9.2 on the Borg CR-10 scale, peak power averaged 333.6 W and stroke rate at exhaustion averaged 40.3 strokes per minute. Time to exhaustion averaged 23.1 minutes.
Those numbers matter for interpretation. They confirm that the rowers reached genuine systemic strain, which is the precondition for calling the kinematic shift a consequence of neuromuscular fatigue rather than of drift in technique or attention across a long session.
The Catch Changed More Than the Finish
At the catch, all three upper-body landmarks moved: head from 1,182.0 mm to 1,163.8 mm, shoulder from 914.3 mm to 882.9 mm and hand from 641.1 mm to 626.9 mm. Effect sizes ran from -0.72 to -1.19, which is large by conventional standards for a neuromuscular fatigue measurement.
At the finish, head height fell from 1,073.7 mm to 1,049.0 mm and hand height from 989.3 mm to 962.8 mm, both with adjusted p = 0.024 and effect sizes near -0.78. Shoulder height at the finish moved 15.2 mm but did not reach significance after correction, adjusted p = 0.099.
The Center of Gravity Followed the Body Down
Vertical center of gravity fell 11.5 mm at the catch and 13.7 mm at the finish, both with adjusted p = 0.045 and an effect size of -0.64 at each phase. The horizontal component moved more, 42.9 mm at the catch, but with wide confidence intervals and no statistical significance.
The asymmetry is informative. Under neuromuscular fatigue these rowers sank rather than slid. That is the signature of a trunk and shoulder girdle no longer holding an upright posture through the drive, which is also the mechanism the authors suggest, while noting they did not measure it directly.
Why the Neuromuscular Fatigue Angle Data Stayed Exploratory
The unadjusted angle trends after neuromuscular fatigue pointed in a coherent direction: more shoulder and elbow flexion, less knee flexion. At the catch the knee closed 4.5 degrees, p = 0.038 before correction and 0.068 after. At the finish the elbow opened 4.1 degrees and the knee closed 2.4 degrees, both around p = 0.03 unadjusted and 0.064 adjusted.
None of those cleared the correction threshold, and the authors are explicit that the number of comparisons relative to the sample size raises the risk of a false positive. The honest reading is that the angle story is a hypothesis for a larger study, not a result. Readers who follow how fatigue gets quantified elsewhere may recognise the same problem from our report on wide variation in countermovement jump fatigue testing across 117 studies.
How Far These Numbers Travel
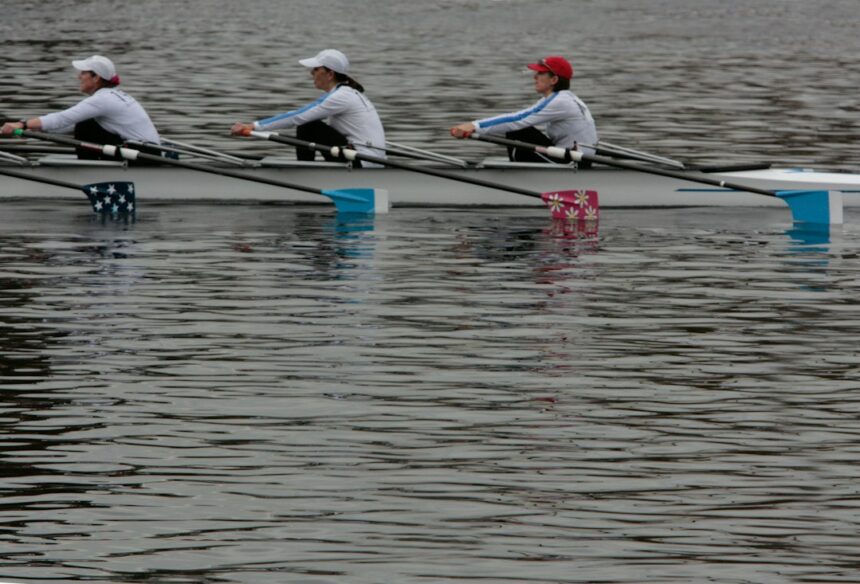
Not very far, and the paper says so. The neuromuscular fatigue testing was done in a sample that was elite, male and specific to fixed-seat rowing, a discipline that loads the trunk and upper limbs differently from Olympic sliding-seat boats. The authors caution against extending the findings to women, to recreational or sub-elite rowers who fatigue earlier and less stably, or to sliding-seat rowing at all.
Testing also happened indoors on an ergometer rather than on water, which removed the instability that might magnify the effect, and the post-fatigue recording followed five minutes of passive rest during which some recovery could have occurred.
What This Means for Anyone Training Hard
The transferable idea is not about rowing. It is that under neuromuscular fatigue the first measurable thing to go may be posture rather than range of motion, and posture is the easier thing to film. A phone on a tripod at a fixed height and distance will show a sinking head and shoulder line across a long piece even when individual joint angles look normal.
For practical use, a few cautious habits follow:
- Film from the same spot and height each time, so changes in posture are comparable across sessions.
- Watch the head and shoulder line as neuromuscular fatigue builds, not only the knees and elbows.
- Treat a visible drop in posture as a cue to stop a technical set, since form work under heavy neuromuscular fatigue teaches the fatigued pattern.
- Keep technical drills early in a session and conditioning later, where posture decay costs less.
That last point echoes a theme running through recent work on readiness and timing, including our coverage of jump height rising 5.5% some 30 hours after resistance priming. How joint position itself alters muscle behaviour is covered in our report on quadriceps stiffness changing sharply with hip and knee position, and for the endurance side of fatigue measurement, see our piece on lactate accumulation rate and threshold power in 182 cyclists and triathletes.
The Fitness Living Takeaway
In 19 elite fixed-seat rowers, an incremental test to exhaustion lowered head, shoulder and hand heights by 14 to 31 mm and dropped the vertical center of gravity by about 12 to 14 mm, while joint-angle changes did not survive statistical correction.
This is a small, single-session, male, elite and discipline-specific study, so it establishes a measurement approach rather than a training rule. What it does suggest is that postural height is a more sensitive marker of neuromuscular fatigue than the joint angles usually monitored, and that three-dimensional analysis can pick up the change while technique still looks intact to the eye, well before neuromuscular fatigue becomes obvious on video.
Research & Sources
- Frontiers in Sports and Active Living: Neuromuscular fatigue induces phase-specific multisegmental kinematic adaptations in elite traditional rowers
- Frontiers in Sports and Active Living: recently published articles
- Study DOI: 10.3389/fspor.2026.1950960
- Images: David Trinks / Unsplash; Josef Stepanek / Unsplash
This article summarizes peer-reviewed research for general information and is not individualized medical or exercise advice.