A pooled analysis of 112,855 adults aged 50 and older ties taking up exercise after a sedentary stretch to markedly less functional decline in the years that follow. Giving activity up pointed the other way, toward more functional decline and slower recovery.
Functional Decline in later life is usually drawn as a slope running one way. A longitudinal analysis published on October 22, 2026 in BMC Public Health treats it instead as a set of doors that swing in both directions, and asks what happens to those doors when a person changes how much they move.
The work came from the College of Physical Education and Sports at Beijing Normal University, with Yulin Luo as first author and Xiangqin Song as corresponding author. The team pooled five long-running population studies of aging: the Health and Retirement Study in the United States, the English Longitudinal Study of Ageing, the Survey of Health, Ageing and Retirement in Europe, the China Health and Retirement Longitudinal Study and the Mexican Health and Aging Study.
Of 266,204 participants who met the age criterion, 115,140 had usable paired observations and 112,855 entered the primary complete-case analysis. Change in physical activity between the first and second measurement was sorted into four groups: stable inactive, became active, became inactive and stable active.
Functional status was coded in three states. Independent meant no reported disability. The middle state was disability in instrumental activities of daily living only, the tasks such as shopping or managing money that let a person run a household. The third was disability in basic activities of daily living, the self-care tasks of dressing, bathing and eating.
At a Glance
- Published October 22, 2026 in BMC Public Health, DOI 10.1186/s12889-026-29979-2, from Beijing Normal University.
- 112,855 adults aged 50 and older drawn from five population-based aging cohorts in the United States, England, continental Europe, China and Mexico.
- Becoming active, against staying inactive, carried a hazard ratio of 0.58 (95% CI 0.46 to 0.72) for the first step into functional decline.
- Becoming active also carried a hazard ratio of 1.73 (95% CI 1.40 to 2.13) for recovering from basic disability back to independence.
- Stopping activity carried a hazard ratio of 1.28 (95% CI 1.03 to 1.58) for losing independence and 0.66 (95% CI 0.61 to 0.72) for recovery.
- Median interval between the two measurements was two years in four cohorts and three years in the Mexican cohort.
- Main caveat: between-cohort heterogeneity ran from 26.1 percent to 98.5 percent, and 12 of 18 prediction intervals crossed the no-effect line.
How Five Aging Cohorts Were Pooled Into One Model
Rather than stacking every participant into a single dataset, the authors fitted each cohort separately with a continuous-time three-state Markov model. That design estimates the intensity of movement between states rather than a simple yes-or-no outcome at the end of follow-up, which suits a condition where people slide down and climb back up.
The separate cohort estimates were then combined by random-effects meta-analysis. Death was deliberately not modelled as a state, a decision that keeps the model focused on functional decline and recovery among survivors. A multiple-imputation sensitivity analysis sat alongside the complete-case primary analysis and pointed in the same direction.
Taking Up Activity Bent the Functional Decline Curve
Against adults who stayed inactive across both measurements, those who became active moved from independence into instrumental disability at a hazard ratio of 0.58, with a 95% confidence interval of 0.46 to 0.72. Expressed as a percentage, that is a 42 percent lower rate of taking the first visible step into functional decline.
The confidence interval matters as much as the point estimate here. It sits well clear of 1.0 at both ends, so the pooled signal for slower functional decline is not a borderline result in the primary comparison. Adults who were active at both measurements showed the most favourable profile of all four groups.
What the model cannot say is why. An observational design captures who changed their habits, not what made them change. Illness that has not yet been diagnosed can push a person off their daily walk months before it shows up as functional decline, and that sequence would produce the same association without the exercise doing the work.
Stopping Activity Produced the Mirror Image
Adults who had been active and then stopped showed the pattern in reverse. Against those who stayed active, their rate of moving from independence into instrumental disability carried a hazard ratio of 1.28, with a 95% confidence interval of 1.03 to 1.58. That interval only just clears 1.0, so the cessation signal for functional decline is weaker than the initiation signal.
The recovery side was more decisive. For the climb back from basic disability to independence, activity cessation carried a hazard ratio of 0.66, with a 95% confidence interval of 0.61 to 0.72. In plain terms, people who stopped moving recovered at about two thirds the rate of those who kept going.
Recovery Moved as Much as Functional Decline Did
The most striking number in the paper is not on the deterioration side at all. Adults who became active recovered from basic disability back to independence at a hazard ratio of 1.73, with a 95% confidence interval of 1.40 to 2.13, against those who stayed inactive.
That reframes the usual conversation. Most coverage of exercise and aging treats functional decline as the only thing worth preventing, and treats a lost ability as permanent once it is gone. These pooled estimates suggest the return trip is also on the table, and that it may be the transition most responsive to a change in habit.
It is consistent with what smaller trials have reported in narrower settings. Work on reactive balance training in older adults and on elastic band training for women with sarcopenia has shown measurable gains in function in people who had already lost ground.
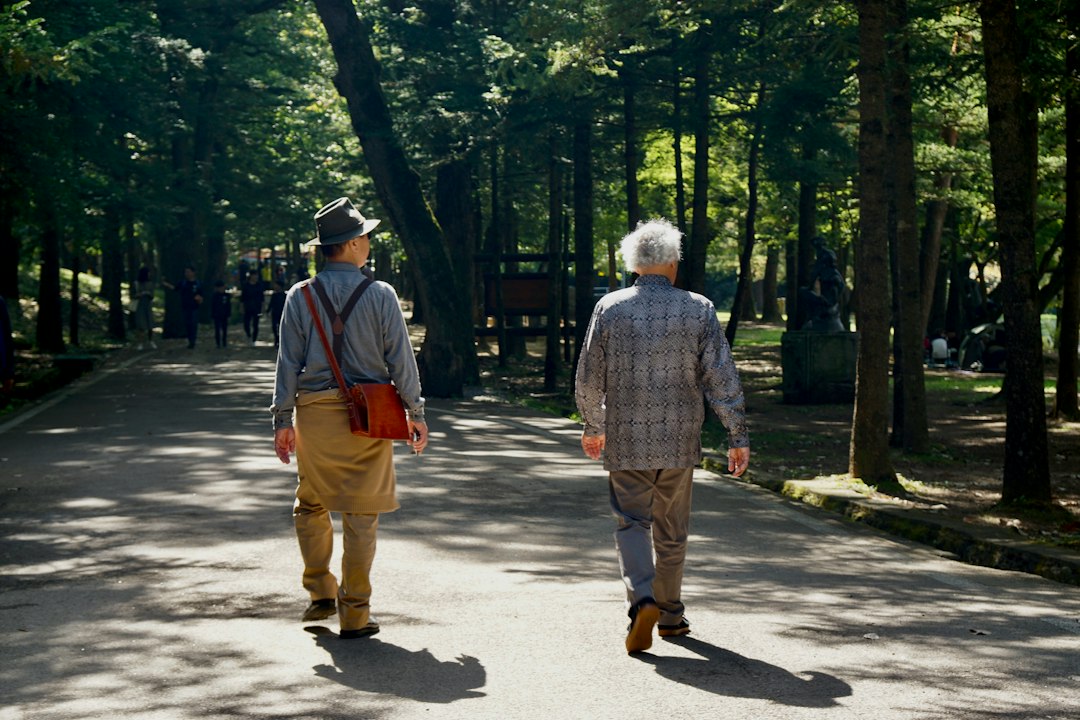
Lower rate of moving from independence to instrumental disability among adults who became active, against those who stayed inactive.
Where the Pooled Numbers Get Shaky
Heterogeneity between cohorts ran from 26.1 percent to 98.5 percent depending on the transition. At the upper end, that means the cohorts were telling meaningfully different stories about functional decline, and the pooled average is a summary of disagreement rather than of consensus.
The authors also report that 12 of the 18 prediction intervals included 1. A prediction interval asks what a new cohort might show rather than how precise the average is. When most of them cross the no-effect line, a sixth survey in a sixth country could plausibly find nothing for several of these transitions.
Measurement is the other soft spot. Physical activity in these surveys is self-reported, and the five studies do not ask the question identically. Functional status is self-reported too. Both sides of the functional decline equation therefore rest on what people say about themselves, a limitation shared by most large aging cohorts.
What Adults Over 50 Can Reasonably Take From This
The honest summary is narrow. This analysis cannot tell any individual that starting to exercise will prevent functional decline, and it does not identify a dose, a mode or a minimum. What it does is describe, across five countries, a consistent direction: the people who started moving fared better on both deterioration and recovery than the people who did not.
Public guidance has not changed on the back of one paper. The World Health Organization still recommends at least 150 minutes of moderate activity a week for adults, or 75 minutes of vigorous activity, with balance and fall-prevention work on three or more days a week for older adults who have poor mobility. Roughly 23 percent of adults worldwide fall short of the general target.
A few practical points follow from the study design rather than from any single number:
- The comparison that moved most was inactive to active, not active to more active, so the first step appears to matter more than the size of the step.
- Recovery was measured from basic disability, meaning the sample included people who had already lost ground, not only the healthiest volunteers.
- The measurement gap was two to three years, so this describes medium-term patterns in functional decline, not what happens within a single season.
- Anyone with a heart, joint or balance condition should get individual clearance before changing their routine, because a population average says nothing about one person.
Readers tracking this area may also want the earlier FLM coverage of exercise snacking and frailty in older adults and of physical activity and memory across older populations, both of which sit on the same question from different angles.
The Fitness Living Takeaway
Across 112,855 adults aged 50 and older in five countries, taking up physical activity was associated with a 42 percent lower rate of the first step into functional decline and a 73 percent higher rate of recovering independence.
The recovery estimate is the part that deserves attention, because it treats lost function as something that can be regained rather than only delayed. The design is observational, the activity data are self-reported and the disagreement between cohorts is large, so the direction is more trustworthy than the size. It is a reason to start moving, not a guarantee of any particular outcome.
Research & Sources
- BMC Public Health: Changes in physical activity and transitions between functional states among adults aged 50 years or older
- Study DOI
- World Health Organization: Physical activity in facts and figures
- Images: Mark Timberlake / Unsplash; Beth Macdonald / Unsplash
This article summarizes peer-reviewed research for general information and is not individualized medical or exercise advice.